“Statistics are like bikinis. What they reveal is suggestive, but what they conceal is vital.” [Aaron Levenstein]
Abstract
Of course you could write a data checking program for any specified input.
But what if you would like to throw any arbitrary data (given in a csv file!) into a general data analyzer?
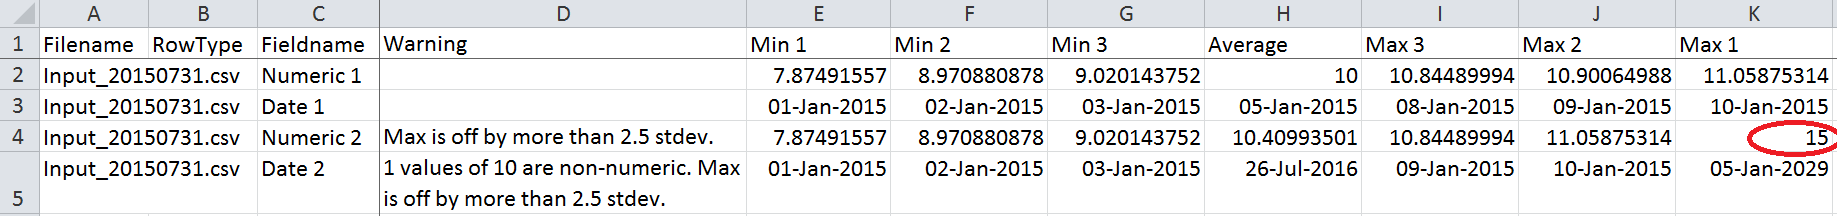
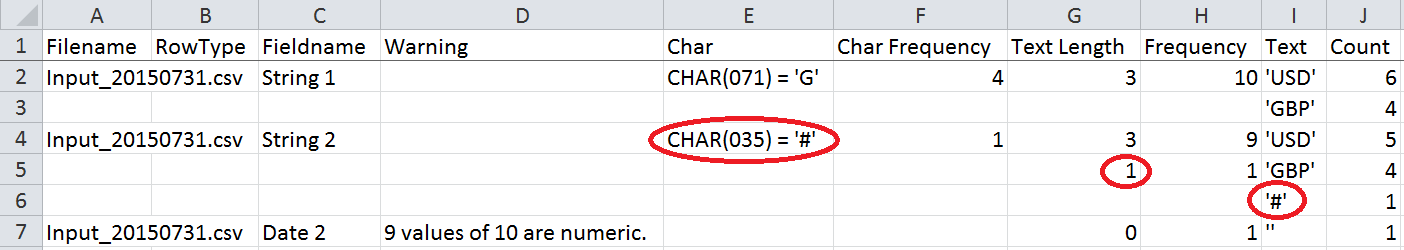
For numerical data a general analysis could easily produce minimum, average, and maximum information and also warn if any extreme value differs from the average by more than 2.5 standard deviations, for example. For text data an analysis program could print text frequency and character frequency information.
Example
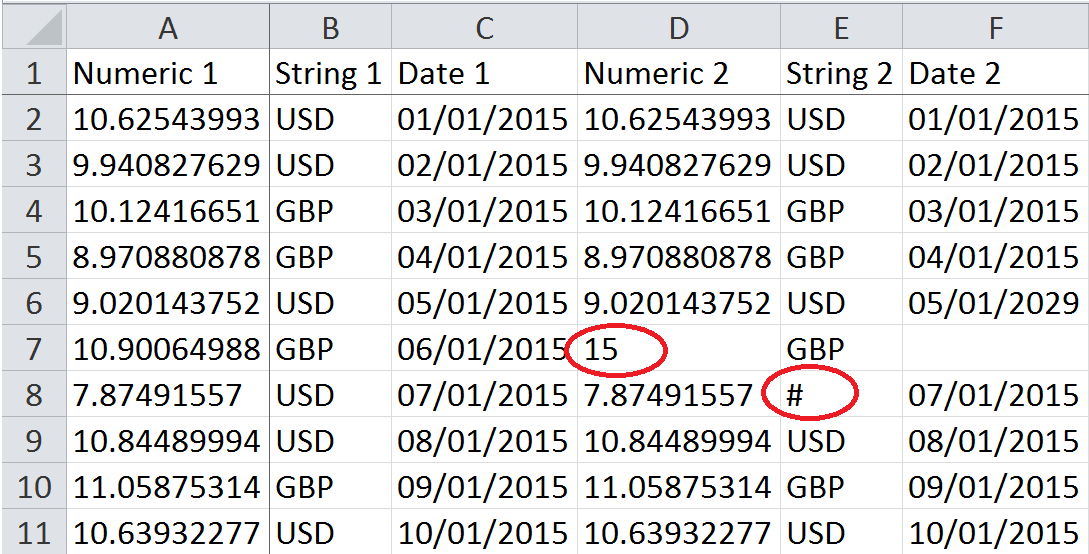
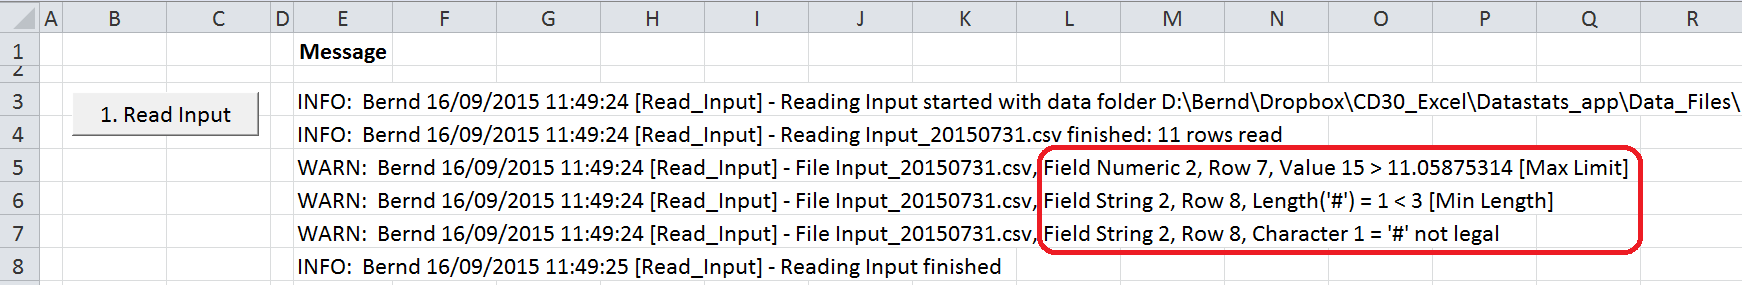
Well, you would like to detect the numerical data outlier 15 and the text data outlier ‘#’ easily with a general data analyzer, right?
sbDataStats produces this output:
Tab and/or output file Numstats:
Tab and/or output file Textstats:
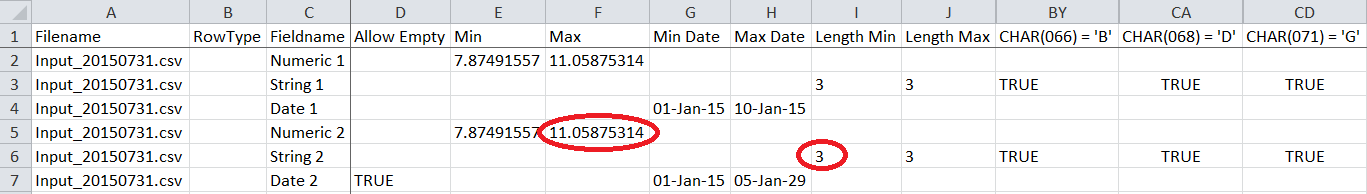
If the user is willing to invest some more effort, sbDataStats can create a limits file which lists minimum and maximmum values for numerical fields (as well as for date fields because they are treated as numbers within Excel), and minimum and maximum text lengths and which characters are used. If the user amends these values to ranges he deems valid and if he then feeds this as a limits input file, then we can get:
Sample Limits file:
Sample tab Workflow output:
The current version can also compare moves over two periods of time. Please keep in mind that you need to provide a sort column for each input file name/type (if it’s not an Algo file - for those an Algo header file is required).
Download
The documentation for this application you can open and read here:
sbDatastats_Documentation.pdf [627 KB PDF file, open and use at your own risk]
Please read my Disclaimer.
sbDatastats.xlsm [180 KB Excel file, open and use at your own risk]